
XAPPmedia today released the Internet Radio Ad Load Report for Q2 2015 and the data show that both the ad load and number of advertisers rose over the previous quarter. It also shows that Taco Bell, GEICO and NAPA had the heaviest spot rotation during the quarter. And, the presence of local advertisers nearly doubled from the previous quarter.

Advertisers Increase, Driven by Local
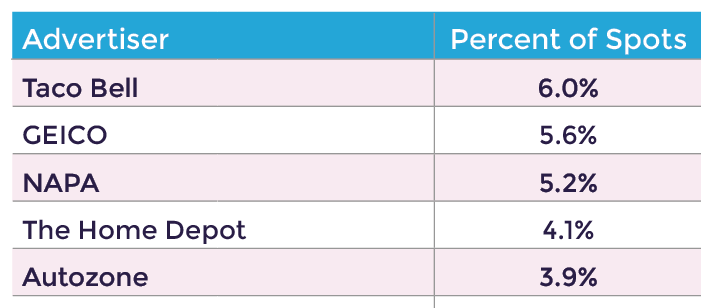 More advertisers were identified across the five listening apps in the second quarter than either of the previous two quarters. In all, 149 distinct advertisers were identified compared to 118 in Q1. Taco Bell accounted for 6% of all audio spots with GEICO coming in 5.6%. The top 10 advertisers in terms of total spots are included in the full report.
New local advertisers accounted for half of the gain in the quarter and rose to 21% of the advertisers identified from 15% in the previous quarter. The report also includes an analysis of advertiser concentration by publisher, as well as the top advertisers appearing in multiple listening apps.
Ad Load Rises
The other key finding from the quarter is that ad load rose about 10% from Q1. The average ad load from Q2 was 2 minutes and 32 seconds (2:32), up from 2:18 in the previous quarter. Even with the increase, the ad load for Internet radio is still only about 22% of that found in a typical hour of broadcast radio listening.
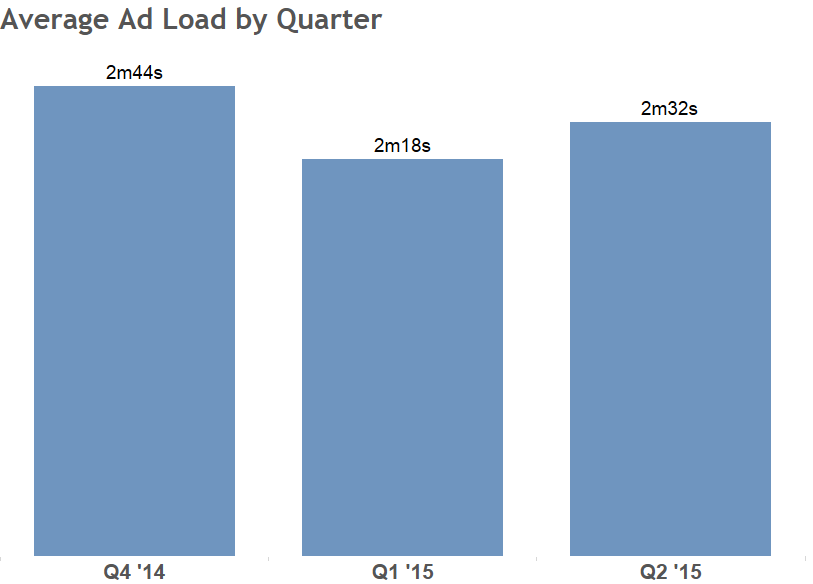
We suspected that the 15% decline in ad load between Q4 and Q1 was largely an ad inventory sell-through problem based on the seasonality of ad spending as opposed to declining advertiser interest in the channel. The Q2 data shows a strong bounce back with three of the publishers materially increasing ad load during the quarter. This means they were able to sell significantly more of their ad inventory even with a rising user base.
15 Charts with Analysis
The Internet Radio Ad Load Report Q2 2015 contains 15 charts along with analysis of the findings. Some of charts include:
- Ad Load by Month
- Ad Load by Publisher
- Average Ad Spots Served Per Hour
- Average Time to First Ad (TTFA)
- Percent of Ads by Ad Length
- Advertiser Concentration
We hope you find the report to be a useful reference in better understanding the rapidly evolving Internet radio industry. Nielsen estimates that 95% of all Internet radio users choose ad-supported listening. Given consumer preferences, advertising is going to be a critical driver for the industry that already reaches more than half of the U.S. population each month.
Related Posts
Internet Radio in Q1 – Ad Load Falls, New Advertisers Rise
More Advertisers Identified on Internet Radio
Nielsen Data Confirm Listener Time Shift to Ad-Supported Online Audio