
IFPI released its annual Global Music Report last week and it always creates a lot of news, but little of it goes beyond the narrative forwarded by the report. However, as with all of these releases by recording industry associations it is often worthwhile to go behind the numbers to see what is really going on and the motives behind the narrative. It is also worth noting that even though you might think the Recording Industry of America (RIAA) would report a subset of IFPI given that it is a global report; they report numbers differently.
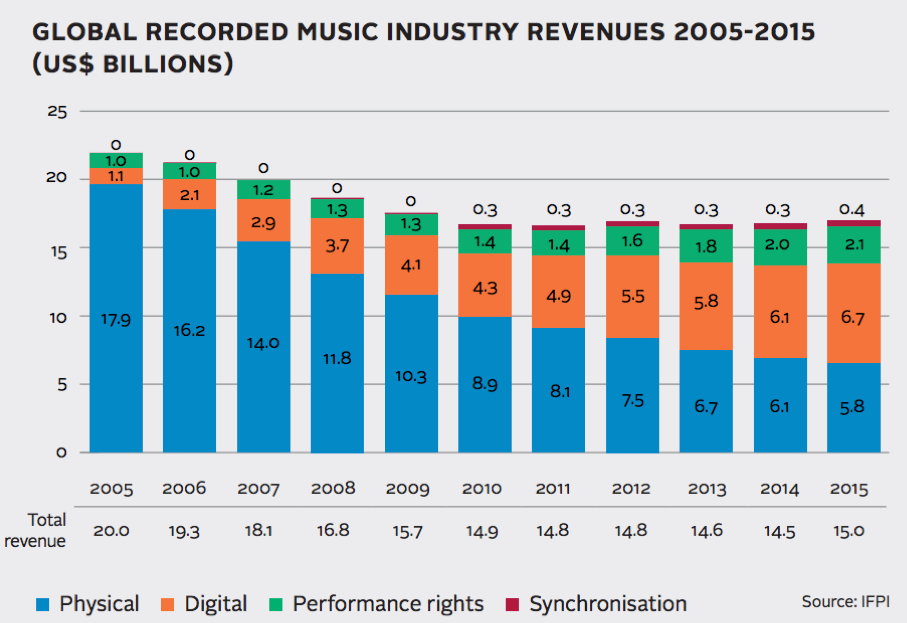
One thing that is consistent among the two associations is relatively flat total industry revenue but a rapidly growing digital category (e.g. seen in orange in the IFPI chart below). Within digital there is also rapid growth in streaming as it grows to a third of all industry revenue.
Ad-Supported Streaming Revenue Larger Than Appears
However, there is a perpetual issue with the RIAA differentiating ad-supported streaming from direct contracts from statutory licensing – also know as SoundExchange distributions. Given that the statutory licensing is more than double the size of direct licensing for advertising, this appears to underreport the total contribution of advertising. Here is where the two reports are somewhat aligned. IFPI also excludes this. Since it is a uniquely American phenomenon, they might be excused. However, it distorts the numbers since it accounts for 68% of U.S. ad-supported streaming revenue and would account for 22% of global streaming revenue. That is a big deal.
IFPI says that streaming revenue grew in 2015 to $2.89 billion from $2.21 billion in 2014. That is a 31% growth rate (though for some reason the report suggests it is a 45% growth rate, presumably in part due to how they changed their currency rate calculations). Of course, we could add in the SoundExchange distributions and get $3.69 billion in 2015 revenue, up from $2.98 billion 2014. That is a 24% growth rate. The smaller growth rate is largely due to slower growth of SoundExchange revenue.
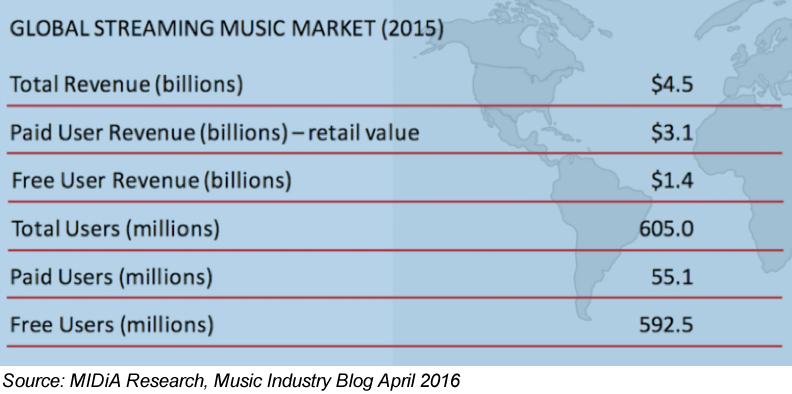
At $3.69 billion, the U.S. would make up 63% of global subscription revenue. However, we have another analysis we can lean on here from one of the top industry analysts. Mark Mulligan of MIDiA research recently pegged total streaming industry revenue at $4.5 billion. That would suggest U.S. comprised 55% of global streaming revenue in 2015 which seems more likely. Whether you use the $3.69 billion or $4.5 billion estimate it is clear that IFPI underreports industry revenue from streaming.
Both IFPI and RIAA lament that streaming usage is climbing faster than streaming revenue. This appears to be fact. Mulligan points out that your viewpoint is important when considering this narrative. There is a natural conflict between defining streaming as a replacement for retail sales (i.e. physical or digital) or for radio. It looks like streaming is monetizing today better than radio and not as well as retail sales. His article on this is well worth a read (click this link).
IFPI and RIAA have long drawn the majority of their revenue from retail sales and there is a natural inclination to blame the retail sales decline entirely on streaming. However, the facts don’t back this up. You can see an in-depth analysis here from XAPP. Retail sales were steadily falling long before streaming took hold. The introduction of digital downloads, the rise in piracy, and changes in consumer attitudes all played significant roles. Streaming is actually saving the industry.
Determining Global Streaming Users
Last week, we estimated a global streaming user base of 686 million to 1 billion listeners of which 68-100 million were subscription users and the balance were accessing ad-supported service options. Both MIDiA and IFPI start with 68 million subscribers, but MIDiA then discounts that to 55 million, based on the assumption that 12 million subscribers actually are not users but merely have access to the service via their telecom provider. This would suggest that the estimated 15 million (N.B. or 30 million if you use the Digital Music News number) users of the SiriusXM mobile streaming app are not true subscribers.
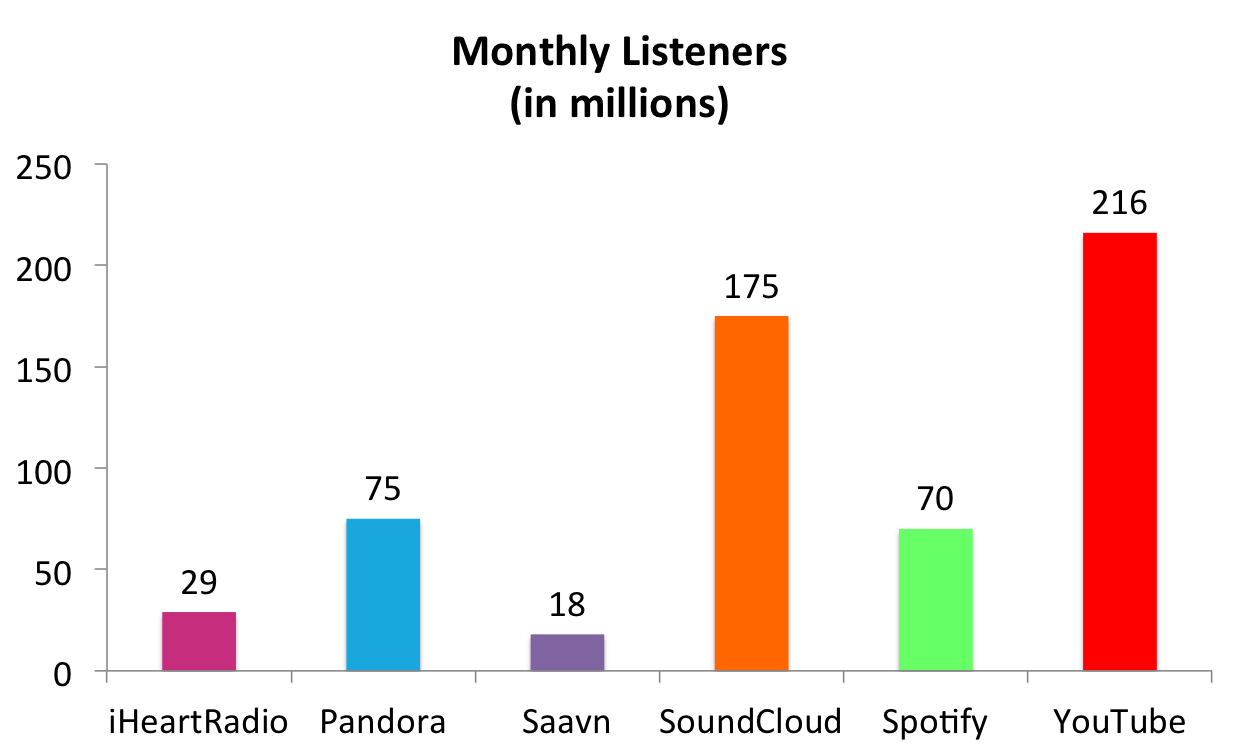
Again we run into definitional terms. It also doesn’t necessarily account for YouTube users which most people agree is the largest music streaming service. IFPI data from its 2015 Global Music Report suggests that 27% of YouTube users listen to the music without watching the videos. IFPI data from the 2016 report suggests 800 million use YouTube monthly for music consumption which would mean 216 million users on that platform listen without watching the videos. Of course, there is likely double-counting here. Many people that use YouTube for music consumption also listen on other streaming services.
But, here is a question. Does it really matter? The audience is large both in the U.S. and globally. It is also growing quickly and contributing between 24-34% of revenue depending how you count. In the U.S., Edison Research estimates that 57% of the population listens to Internet radio streaming services monthly and 50% do so weekly. For advertisers, this is a large domestic and global market.
The Need for Better Monetization for Ad-Supported Listening
The other thing that is clear from the data is that ad-supported listening needs better monetization. Whether you use the IFPI or MIDiA research numbers of 91% or the Strategy Analytics estimate of 89%, the vast majority of streaming consumers have chosen ad-supported listening. Again, depending on the data you cite, ad-supported listening represents about 50% in the U.S. and 31% of global streaming revenue. However, revenue from ad-supported listening is limited by what advertisers will pay.
At XAPP, we think we have at least a partial solution to this problem. Advertisers are willingly paying 4-5 times more for XAPP Ads than standard audio ads. Why? Because they deliver far higher performance. Our data show that between 76-87% of the time ads are served while listeners aren’t looking at the screen. That means listeners can’t immediately touch the screen to respond to ads that interest them.
By contrast, XAPP Ads enable users to respond by speaking a simple prompted phrase. It doesn’t matter if they have access to the mobile device screen or not. They can still interact with the ad instantly by voice. The feature enables XAPP Ads to deliver response rates up to 20-30 times higher than standard ads. That performance is the driver behind higher ad rates and more industry revenue.
In the U.S. if you were to capture 4 times higher rates for direct contract ad-supported streaming and then add it to the SoundExchange revenue (N.B. the SoundExchange revenue wouldn’t change because the royalties are a flat rate per spin instead of a percent of revenue sharing model used in most direct contracts), ad-supported listening would generate 65% of streaming revenue. A similar analysis for global data estimates 58% of revenue.
There are monetization options that can drive higher industry revenues while helping both streamers and royalty holders. Solutions like XAPP can bring more revenue into the industry and alleviate some of the friction existing today between streamers and royalty holders.
[su_button style=”flat” size=”6″ background=”#D73C90″ radius=”0″ url=”https://go.pardot.com/emailPreference/e/35552/300″ target=”_blank”]Subscribe to XAPP Blog[/su_button]
Related Posts
What Streaming Music Subscription Numbers Reveal About Ad-Supported Listening
Edison Research: Internet Radio Weekly Listeners Hit 50% of U.S. Population
Download Internet Radio Ad Load Report Q4 2015: Advertisers Grow 5x in 2015, Ad Load Up 5.7%